Auto-scale History for Azure Files Shares
The auto-scale history visualization helps you understand auto-scale behavior and how it impacts your deployment.
The following are important auto-scale history features.
-
Time Range: At the top of the window, select the desired time range to display.
-
Show: At the top of the window, select the desired graph(s) to display.
-
Savings: At the top of the window, you can view auto-scale savings.
-
Zoom In: For the Quota (GiB) graph only, click and drag the mouse over the section of the graph you wish to zoom in on. When you are zoomed in, select Zoom-out to restore the full graph.
-
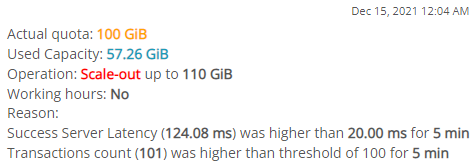
Hover: You can hover over any part of any graph to see its details. For example:
-
Action Points:
-
 Scale Out: This action point indicates that a scale-out event took place. (Red indicates that the scale-out event is costing money.)
 -
 Scale In: This action point indicates that a scale-in event took place. (Green means that the scale-in event is saving money.)
 -
 Azure Issue: This indicates that there was a problem communicating with Azure. If this occurs frequently, please contact Nerdio Manager technical support.
-
-
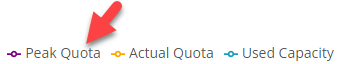
At the bottom of any graph, select the data set name to toggle on/off the display line associated with that information. For example, select Peak Quota to suppress that line on the graph. Select it again to display it.
To view auto-scale history for an Azure Files share:
-
Navigate to Storage > Azure Files.
-
Locate the file share you wish to work with.
-
From the action menu, select Auto-scale > History.
-
Select the desired time range and the specific graphs to display.
-
Quota (GiB): The Quota graph displays the following information about the file share quota:
-
Peak Quota: The maximum size of the quota.
-
Actual Quota: The actual quota size as it is currently configured.
-
Used Capacity: The actual storage used.
-
-
Latency (ms): The Latency graph displays the following information:
-
Server Latency (avg): The average time used to process a successful request by Azure Storage. This value does not include the network latency specified in the End-to-End Latency.
-
End-to-End Latency (avg): The average end-to-end latency of successful requests made to a storage service or the specified API operation. This value includes the required processing time within Azure Storage to read the request, send the response, and receive acknowledgment of the response.
-
-
Transactions: The Transactions graph displays the number of transactions.
-
Savings%: The Savings graph displays the savings percentage.
-